SOS: Map Prototype 1

skreutzer
02:00 AM | 26 Jan 2019
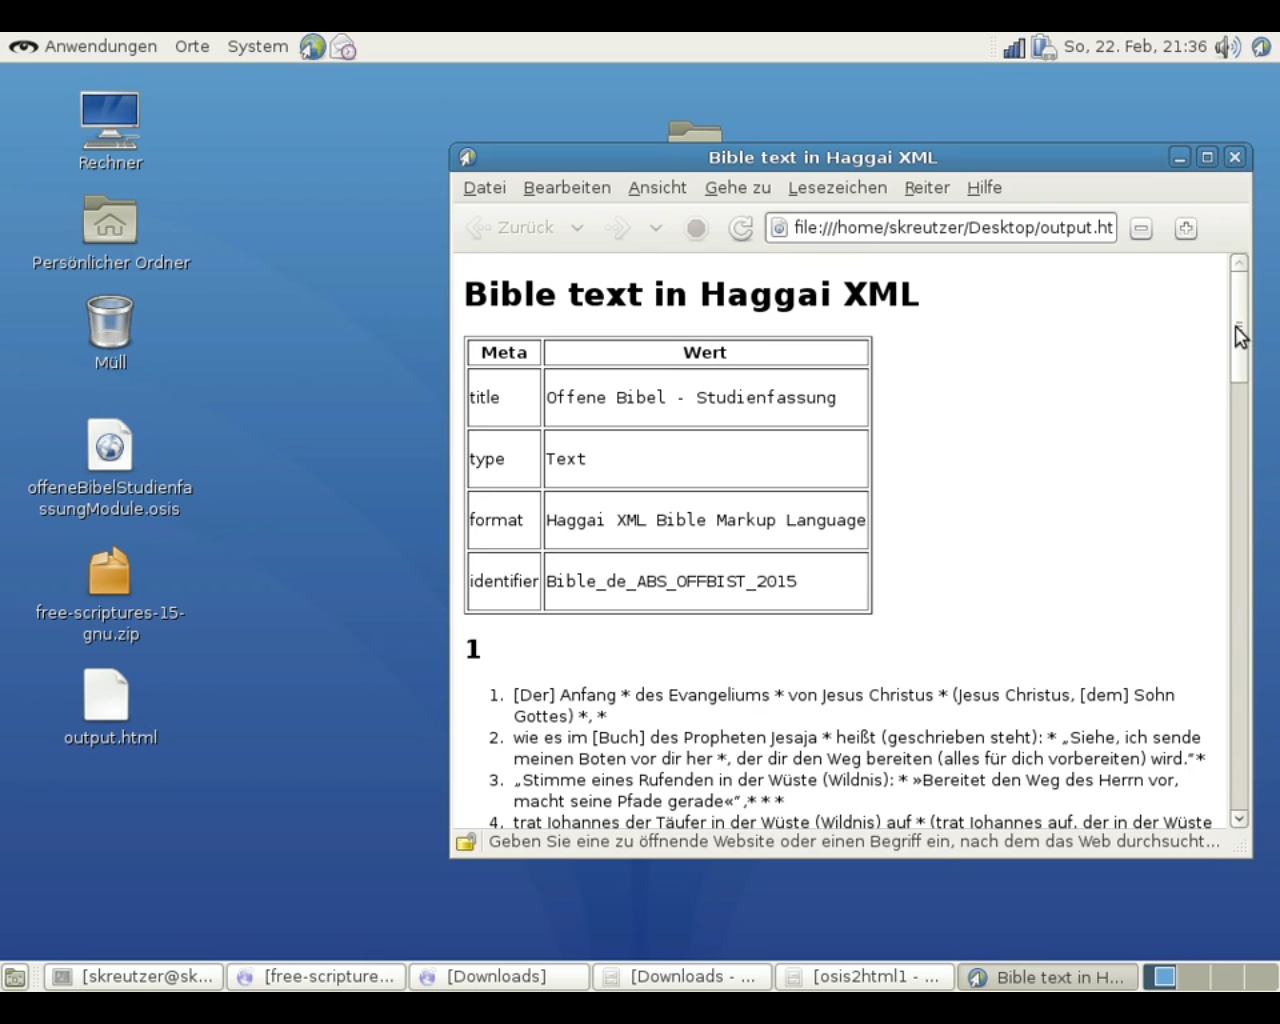
http://www.untiednations.com/community/plan-sos/ https://github.com/cgutteridge/webleau https://gitlab.com/skreutzer/sos-experimental/tree/master/prototypes/sos-map-1 https://skreutzer.de/htx/de_skreutzer_20190109T015500Z_what_are_the_diagram_and_map_tools.txt
Category: Technology
-
 Wael AlsaadI couldnt find in the video relation to SOS . What are there map entries and how can they get filled?


examples · master · Stephan Kreutzer / sos-experimental · GitLab
Some experimentation for http://www.untiednations.com/community/plan-sos/